What Baltic SMEs Really Sell For: Deal Sizes, EBITDA Multiples and Terms
Forget the headline mega-deals. Most Baltic companies change hands below EUR 10 million at roughly five times EBITDA, paid in cash. Here is the data – and what moves a company above or below the average.
Every seller believes their company is worth more than the market says, and every buyer suspects the opposite. The useful thing about the Baltic market is that there is now enough published data to replace opinion with a range. This article pulls together what is known about deal sizes, pricing and terms for small and mid-sized companies in Estonia, Latvia and Lithuania.
Deal sizes: the market is small-ticket
The Sorainen Baltic Private M&A Deal Points Study 2024, which analysed 179 private transactions signed between April 2022 and March 2024, gives the clearest picture of the size distribution:
- EUR 1–5 million: 38% of deals
- EUR 5–10 million: 20%
- EUR 10–25 million: 23%
- EUR 25–50 million: 12%
- EUR 50–100 million: 4%
- Over EUR 100 million: 3%
Nearly six in ten private deals are worth less than EUR 10 million. The market that owner-managers and individual buyers operate in is the first two bands.
Multiples: around five times EBITDA
No Baltic-only multiple series is published, but the closest regional benchmark is Dealsuite's CEE M&A Monitor, based on a survey of 107 advisers. For SMEs with EBITDA between EUR 200,000 and EUR 10 million, the average EBITDA multiple was 5.2x in the first half of 2025, marginally down from 5.3x in the previous period.
The average hides a wide spread. In practice a Baltic SME's multiple moves with:
- Recurring revenue. Contracts, subscriptions and maintenance agreements are worth more than project income. When Dutch group Your.Online acquired Estonian hosting company Zone Media in August 2026, advisers reported an enterprise value of about EUR 21 million – roughly 10x EBITDA – for a business with highly recurring revenue and thousands of customers.
- Owner dependence. A company that runs without its founder commands a premium; one where the founder is the salesforce is discounted.
- Customer concentration. A top customer above 25–30% of revenue is a recurring price chip.
- Size. Below EUR 300,000 EBITDA, multiples fall because the buyer pool shrinks to individuals and very small strategic buyers, and fixed deal costs weigh more.
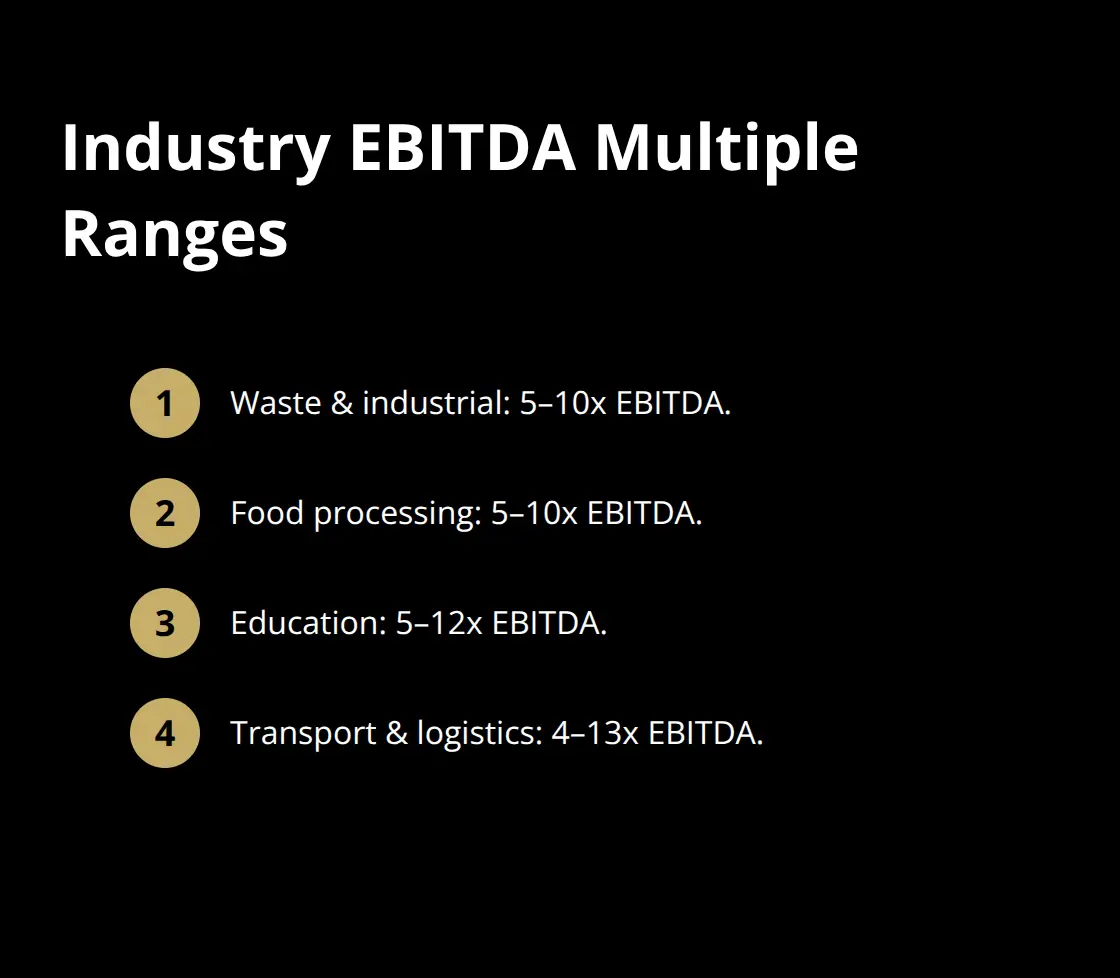
- Sector. Software, healthcare services and consumer brands with growth sit above the average; construction, transport and owner-run retail below it.
Terms: cash, warranties, non-competes
The same Sorainen study documents what the rest of the agreement usually looks like:
- All-cash consideration in 93% of deals. Deferred payments exist but are the exception.
- Earn-outs in 8%. Baltic buyers and sellers largely avoid them; when they appear, they bridge a valuation gap in a growing company.
- Locked box in 31%. The price is fixed at a historical balance sheet; the buyer takes the economics from that date. Completion accounts remain more common.
- Warranty & indemnity insurance in 2%. Sellers give warranties personally and negotiate caps and survival periods.
- Seller non-compete in 64%.
- Buyer due diligence in 83%.
How the wider market moved
Context matters because it sets buyer confidence. Mergermarket counted 231 Baltic deals worth EUR 2.1 billion in 2024 – volume up 42%, value up 76% on 2023 – split Lithuania 41%, Estonia 34%, Latvia 25%. Sorainen recorded seven deals above EUR 100 million that year, against three in 2023. In 2025 announced value rose again to roughly EUR 2.8 billion, but deal count fell about 19% to around 192, with the three largest transactions (Rimi Baltic, Ingka's forestry purchase and the Tele2 towers sale) accounting for EUR 2.46 billion between them. Beneath those, the software (29 deals), consumer (27), services (23) and energy (21) sectors were the busiest.
For the SME seller, the message is that buyers are active and financing is available, but that competition for the best small companies – recurring revenue, clean accounts, management that stays – is what drives prices above the average, not market froth.
Worked example
Illustrative figures. Two Riga companies each report EUR 500,000 normalised EBITDA. Company A is a facilities-management business with three-year contracts covering 70% of revenue, a general manager who has run it for six years and no customer above 12%. Company B is a design-and-build contractor whose founder wins every project personally and whose largest client was 40% of last year's revenue. Company A might reasonably attract offers at 6–6.5x (EUR 3.0–3.25 million); Company B at 3.5–4x (EUR 1.75–2.0 million). Same EBITDA, EUR 1 million-plus difference – and most of that difference can be engineered in the two or three years before a sale.
Using the data
Sellers: run your numbers through our valuation calculator, then ask what would move you up the range. Buyers: use the 5x anchor to test asking prices on current listings, and remember that the terms – warranties, non-compete, handover – are worth negotiating as hard as the headline.
What moves a company off the average
The regional average is a starting point, not a valuation. In practice, the same factors push Baltic SMEs above or below it:
Upward. Recurring or contracted revenue rather than project work. A management team that stays after the sale. Diversified customers, with no single client above roughly 15% of revenue. Real barriers — licences, proprietary technology, a distribution network that would take years to replicate. Growth that is visible in the last three years of filed accounts rather than in a projection. Margins above the sector norm, sustained.
Downward. Owner-dependence, which is the single most common discount in owner-managed businesses. Customer concentration. Revenue that is really a series of one-off projects. Assets that need replacing soon and have not been provided for. Any unresolved tax, environmental or employment exposure. Accounts that cannot be reconciled to management numbers.
The gap between a 4x business and a 6x business of the same size is usually not the industry. It is those items, and most of them are within an owner's control if the work starts a year or two before the sale.
Reading a multiple correctly
Three technical points that cause more confusion than anything else in Baltic SME negotiations:
- Multiples apply to enterprise value, not to what lands in your account. Enterprise value minus net debt plus surplus cash equals equity value. A company with EUR 500,000 of debt and EUR 2 million of enterprise value is a EUR 1.5 million cheque.
- The EBITDA has to be normalised. Add back the owner's below-market or above-market salary to the market rate, remove one-off costs and personal expenses, remove income that will not recur. A buyer will do this themselves and arrive at a lower number than the owner did — be ready to defend each adjustment with evidence.
- Cash inside a Baltic company is not worth face value. Estonia and Latvia tax profit on distribution, so extracting EUR 100,000 of retained earnings costs 22/78 in Estonia and 20/80 in Latvia. Buyers price accordingly, which is why cash-free, debt-free pricing is the norm.
How to use this before you negotiate
Run the arithmetic yourself before the first conversation: normalised EBITDA, a range of multiples from four to six, net debt, and the resulting equity value. If that range is far from the number you had in mind, the useful response is to find out which of the factors above is responsible — and whether it is one you can still change.
Sources
- Sorainen, Baltic Private M&A Deal Points Study 2024 – https://www.sorainen.com/wp-content/uploads/2024/10/Baltic-Private-MA-Deal-Points-Study-2024.pdf
- Dealsuite, CEE M&A Monitor, August 2025 – https://www.dealsuite.com/en/blogs/cee-m-a-monitor-august-2025
- Prudentia, Estonian tech M&A 2026 – https://www.prudentiacf.eu/post/estonian-tech-m-a-2026-eleven-deals-three-very-different-stories
- Mergermarket, Baltic M&A Monitor 2025 – https://ionanalytics.com/insights/mergermarket/baltic-ma-monitor-2025/
- Sorainen, Baltic M&A Market Overview 2024 – https://www.sorainen.com/publications/baltic-m-a-market-overview-2024-the-year-of-revival/
- Sorainen, Baltic M&A Market 2025 Overview – https://www.sorainen.com/publications/baltic-m-a-market-2025-overview/